The truth is in the source code: Bisquat2!
„No one in the brief history of computing has ever written a piece of perfect software. It’s unlikely that you’ll be the first.“ – Andy Hunt
„Any fool can write code that a computer can understand. Good programmers write code that humans can understand.“ – Martin Fowler
In the universe of software development, where the language of bits and bytes controls everything and creates new worlds, many set out to do just that: To create something new. It’s an exciting journey that has a stunningly diverse repertoire to offer, from the first website to the first Docker container or the first AI model. The possibilities seem endless these days. While the creation of applications and programs is in the foreground, one crucial aspect remains hidden in the shadows: the maintainability of software.
Many risks in software systems are not visible “from the outside”. However, these have a serious impact on future costs and the quality of the software. It has been proven that maintainability is the most important factor for the total cost of software over its entire life cycle. Together with the Bonn-Rhein-Sieg University of Applied Sciences (H-BRS), Bitsea has implemented a project supported by the German Federal Ministry for Economic Affairs and Climate to test maintainability in a highly automated and continuous manner.
The last decades of software development have shown how important it is to adhere to coding rules and design patterns in order to ensure good maintainability of software products. Studies confirm a correlation between accumulations of design pattern violations (antipatterns) and exponentially increasing costs for the maintenance of software.
Regular static software analysis is an effective way of meeting these challenges. Static analysis involves calculating various metrics that describe the quality of the software. A few simple examples are LOC (Lines of Code), which shows the length of a class, or NOM (Number of Methods), where the number of methods in a class is counted. If a metric exceeds a certain threshold value, this can indicate potential problems. If such exceedances accumulate, we speak of design pattern violations or “antipatterns”. If we find particularly serious ones or several in a certain area of a system, we speak of “hot spots”, which can have a negative impact on the future viability of the entire system. Hot spots and antipatterns can be resolved through careful refactoring in order to improve quality and maintainability.
Bitsea has specialized in checking software systems for more than a decade and identifies hidden risks. A variety of visualizations clarify the results and facilitate understanding. Nevertheless, the optimum is far from being achieved: a fully automated continuous code review embedded in the development process. This is why Bitsea is working on creating a suitable tool chain.
Our research project was realized as part of the Central Innovation Program for SMEs (ZIM), a funding program of the Federal Ministry of Economics and Climate. Prior to our ZIM project, Bitsea had already come up with Bisquat1 (Bitsea Software Quality Analysis Tool 1), an in-house tool for software analysis. At the open day of the Institute for Visual Computing at Bonn-Rhein-Sieg University of Applied Sciences, the idea of expanding the static analysis with immersive 3D visualizations was initially developed. The modern equipment of the laboratories with 3D glasses and huge high-resolution screens was an invitation to combine this with software analysis. Bisquat1 already had experience of how to implement analysis tools. The extension in terms of comprehensibility with 3D visualizations fitted well into the picture. The addition of dynamic analysis and innovative AI components were further parts of our research idea. A high-performance system with all these components was to be created. We quickly found partners at the university with whom we could further develop and expand the idea.
We can now look back on two years of productive collaboration, during which we have been able to build up an innovative in-house tool chain. With Bisquat2, we are not only able to carry out faster, more efficient, static software analysis, but can also analyze dynamic anomalies. For example, CPU usage and memory leaks are examined. An open source license analysis has also been integrated and evaluations are supported by AI. Bisquat2 also creates 2D graphics, which are complemented by the immersive 3D visualizations of our university partners.
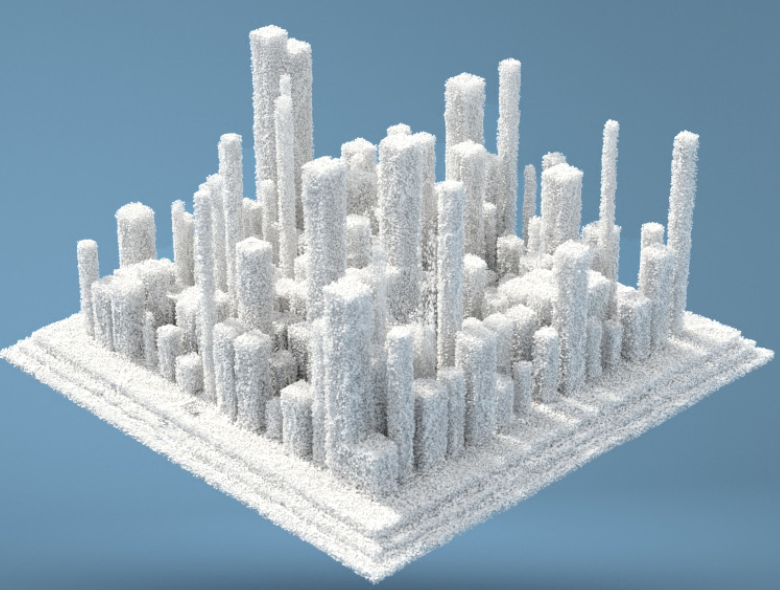
Our university partners shone with their two 3D visualizations: with a virtually implemented “City View”, you can experience software as if you were visiting a city and interactively examine the nature of the code. The second 3D visualization of the H-BRS deals with the vivid representation and composition of the components of a software system and their licenses.
All the new features came with special challenges, and who would we be if we didn’t take them on? Special requirements need special solutions. We found a suitable solution for every problem, combining and implementing our original specifications and use cases for the application with newly emerging ideas in an agile and skillful manner.
Bisquat2 currently supports Java, but this will be supplemented with other programming languages in the near future. Bisquat2 is constantly being expanded and developed. In fact, we are continuously taking up new ideas that are still to be implemented.
Compared to our previous tool chain, Bisquat2 offers many new functions. Bisquat2 processes the source code directly, so only minimal pre-processing is required. The entire analysis process has been shortened by several days with Bisquat2, saving around 60% of the previous working time. This means a high increase in efficiency.
Our Bisquat2 blog series will examine the various functions of Bisquat2 in detail. Bisquat2 can be divided into the following different component groups:
- • Static analysis
- • Dynamic analysis
- • License management
- • 3D visualizations
- • AI
- • Automatic report with optimization recommendations
Each topic will be explained in more detail over the next few weeks, with the benefits, functionality, problems and results being discussed.
 Previous Post


